
Why Your Pentest Quote Keeps Changing and How to Calculate Your Attack Surface
This guide breaks down how pentest scoping actually works, why counting pages and screens systematically undercounts your real attack surface, and how to calculate your REST endpoints, GraphQL operations, and user roles before your next vendor call. Walk in with the right number and get a quote you can actually trust.
What is Pentest Scoping
Pentest scoping is the process of defining what parts of an application will be tested, including endpoints, roles, authentication methods, and integrations. Accurate scoping ensures the test covers the real attack surface and produces reliable cost estimates.
You can ask three vendors for a cost estimate for a penetration test and get three wildly different numbers. Sometimes, it's as low as $4,000 and as high as $50,000. The third needs 5 calls before they will even name a number.
The root cause is rarely bad faith. Scoping a web application pentest is hard. It requires knowledge of your attack surface, and most organizations do not know how to measure it.
The gap is specifically about quantifying the attack surface: translating what you know intuitively into a structured inventory for a pentest. Understanding how vendors scope engagements is the fastest way to get a quote you can trust.
Common Scoping Methods:
Not every pentest firm counts the same things. Before you can evaluate a quote, you need to understand the different lenses vendors use to size a web application pentest.
By domains and subdomains. Some vendors' scope based on how many domains or subdomains are in scope. This is common for infrastructure-focused assessments but tends to undercount modern API-driven applications where most of the attack surface lives behind a single domain.
By the number of features or user stories. This is a softer method that maps to how product teams think. It produces less precise quotes because two features can have vastly different backend complexity.
By the number of dynamic pages. Vendors using this method count screens or pages the user navigates. This is intuitive but systematically undercounts the real attack surface, which we will address in detail below.
The Real Question: How Big is Your Attack Surface
The method a vendor uses to scope your engagement shapes how they think about your application and, therefore, how accurately they can estimate testing effort and penetration testing cost. A vendor counting pages sees a user interface. A vendor counting endpoints sees what an attacker sees: individual backend operations, each of which can be probed, manipulated, and abused.The scoping method is not just a scoping technique. It is a signal of how the vendor views the risk of inadequate coverage of the web application pentest.
Here is a practical way to calculate yours before your next scoping call.
Work through each component of your application and add up the counts.
- REST API endpoints: Open your OpenAPI spec, run your framework’s route dump command, or ask a developer to grep for route definitions. Count unique path-plus-HTTP-method combinations. GET /users and POST /users are two endpoints, not one.
- GraphQL operations: Run an introspection query or open the schema file. Count every field under type Query and every field under type Mutation. These are separate from your REST count.
- User roles in scope: List every distinct permission level that accesses the application (admin, standard user, read-only, unauthenticated, etc.). This does not directly increase the endpoint count, but it multiplies testing effort because a tester must verify authorization for each role on every sensitive endpoint.
- Authentication methods: Note which endpoints require a valid session and which are publicly accessible. Unauthenticated endpoints are the highest-priority attack surface and should be flagged separately.
Add REST and GraphQL operations to get your base attack surface. Then account for roles and authentication methods as effort multipliers rather than additional endpoints. Not all operations carry equal complexity, but counting them provides a consistent baseline for scoping.
When you understand how your attack surface is actually measured, you can come to a scoping conversation with better information, which means a more accurate quote, fewer mid-engagement surprises, and higher confidence that the test actually covered what mattered.
Why Counting URLs and Pages Gets You the Wrong Pentest Quote (And What to Count Instead)
Pentesting is about what an attacker sees (backend functionality), not what the user sees on screen.
Consider a dashboard page. A user sees one screen. Behind that screen, when it loads, the browser might fire 10 separate API calls: one to fetch the user profile, one to load notifications, one to pull recent activity, one to check permissions, and so on.
Each of those API calls is a distinct endpoint. Each one can be targeted independently. A tester who scopes by pages will count one item and miss nine attack vectors.
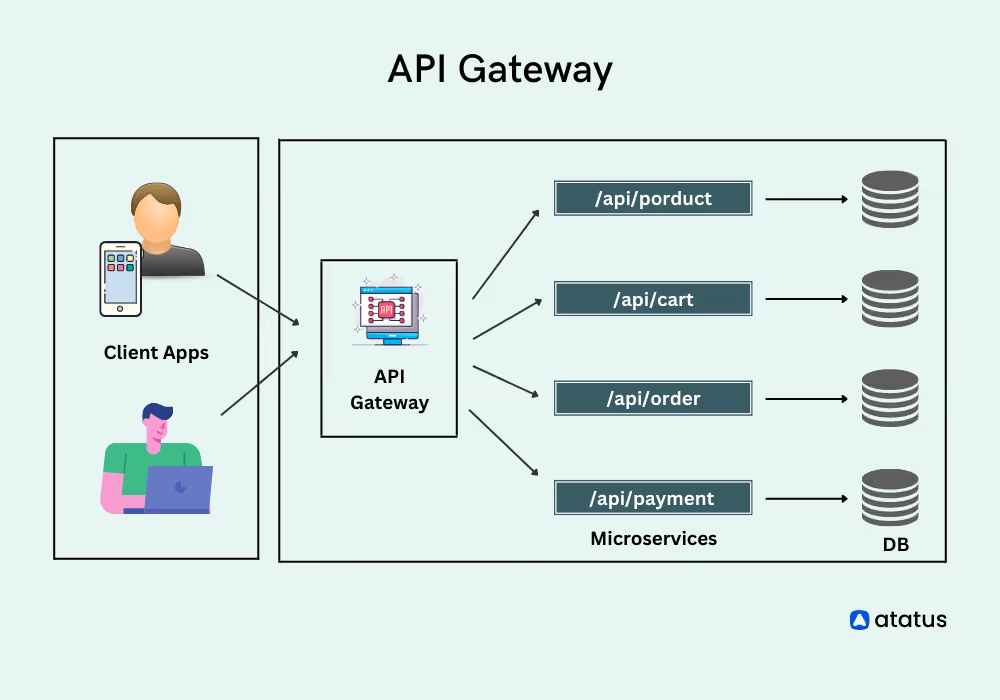
A common mistake is organizations counting the pages or screens in their application and submitting that number as their endpoint count. Page counts are almost always a significant undercount of the real attack surface. A single page in a modern SPA or API-driven application can trigger 5 to 15 separate backend calls. If you submit 12 pages as your scope, you may be describing an application with 80 to 120 endpoints, which represents a completely different testing engagement. The risk is a lack of coverage for the budget that you get approval for and, in turn, an untested attack surface that a hacker can exploit.
Why Software Secured uses a more granular approach
Software Secured scopes web application pentests using endpoint and operation counts because they are the most direct proxy for testing effort. Each endpoint is a door a tester must test, open, and attempt to walk through in unexpected ways. The number of doors determines how long the engagement takes.
The endpoint-counting method is increasingly used and is considered effective for modern API-driven apps because it ties the quote directly to the actual attack surface. If an endpoint was not in the agreed-upon count, there is a clear paper trail. The result is more accurate quotes and fewer mid-engagement disputes. Scope-creep conversations become straightforward rather than subjective. It ensures that the penetration testing cost you pay reflects the application you actually have.
There is a risk for firms that use loose scoping methods upfront, as they may then flag additional endpoints mid-engagement as out of scope or as billable additions. A firm that asks you for a specific endpoint and operation count before quoting is generally signaling more rigorous engagement management, not just billing precision.
How to Count REST API endpoints
Before you start, internalize one critical concept: paths are not endpoints. The/users path is not a single endpoint. If your application supports GET /users, POST /users, and DELETE /users/{id}, that is three endpoints. The HTTP verb is part of the identity. Count unique path-plus-method combinations.
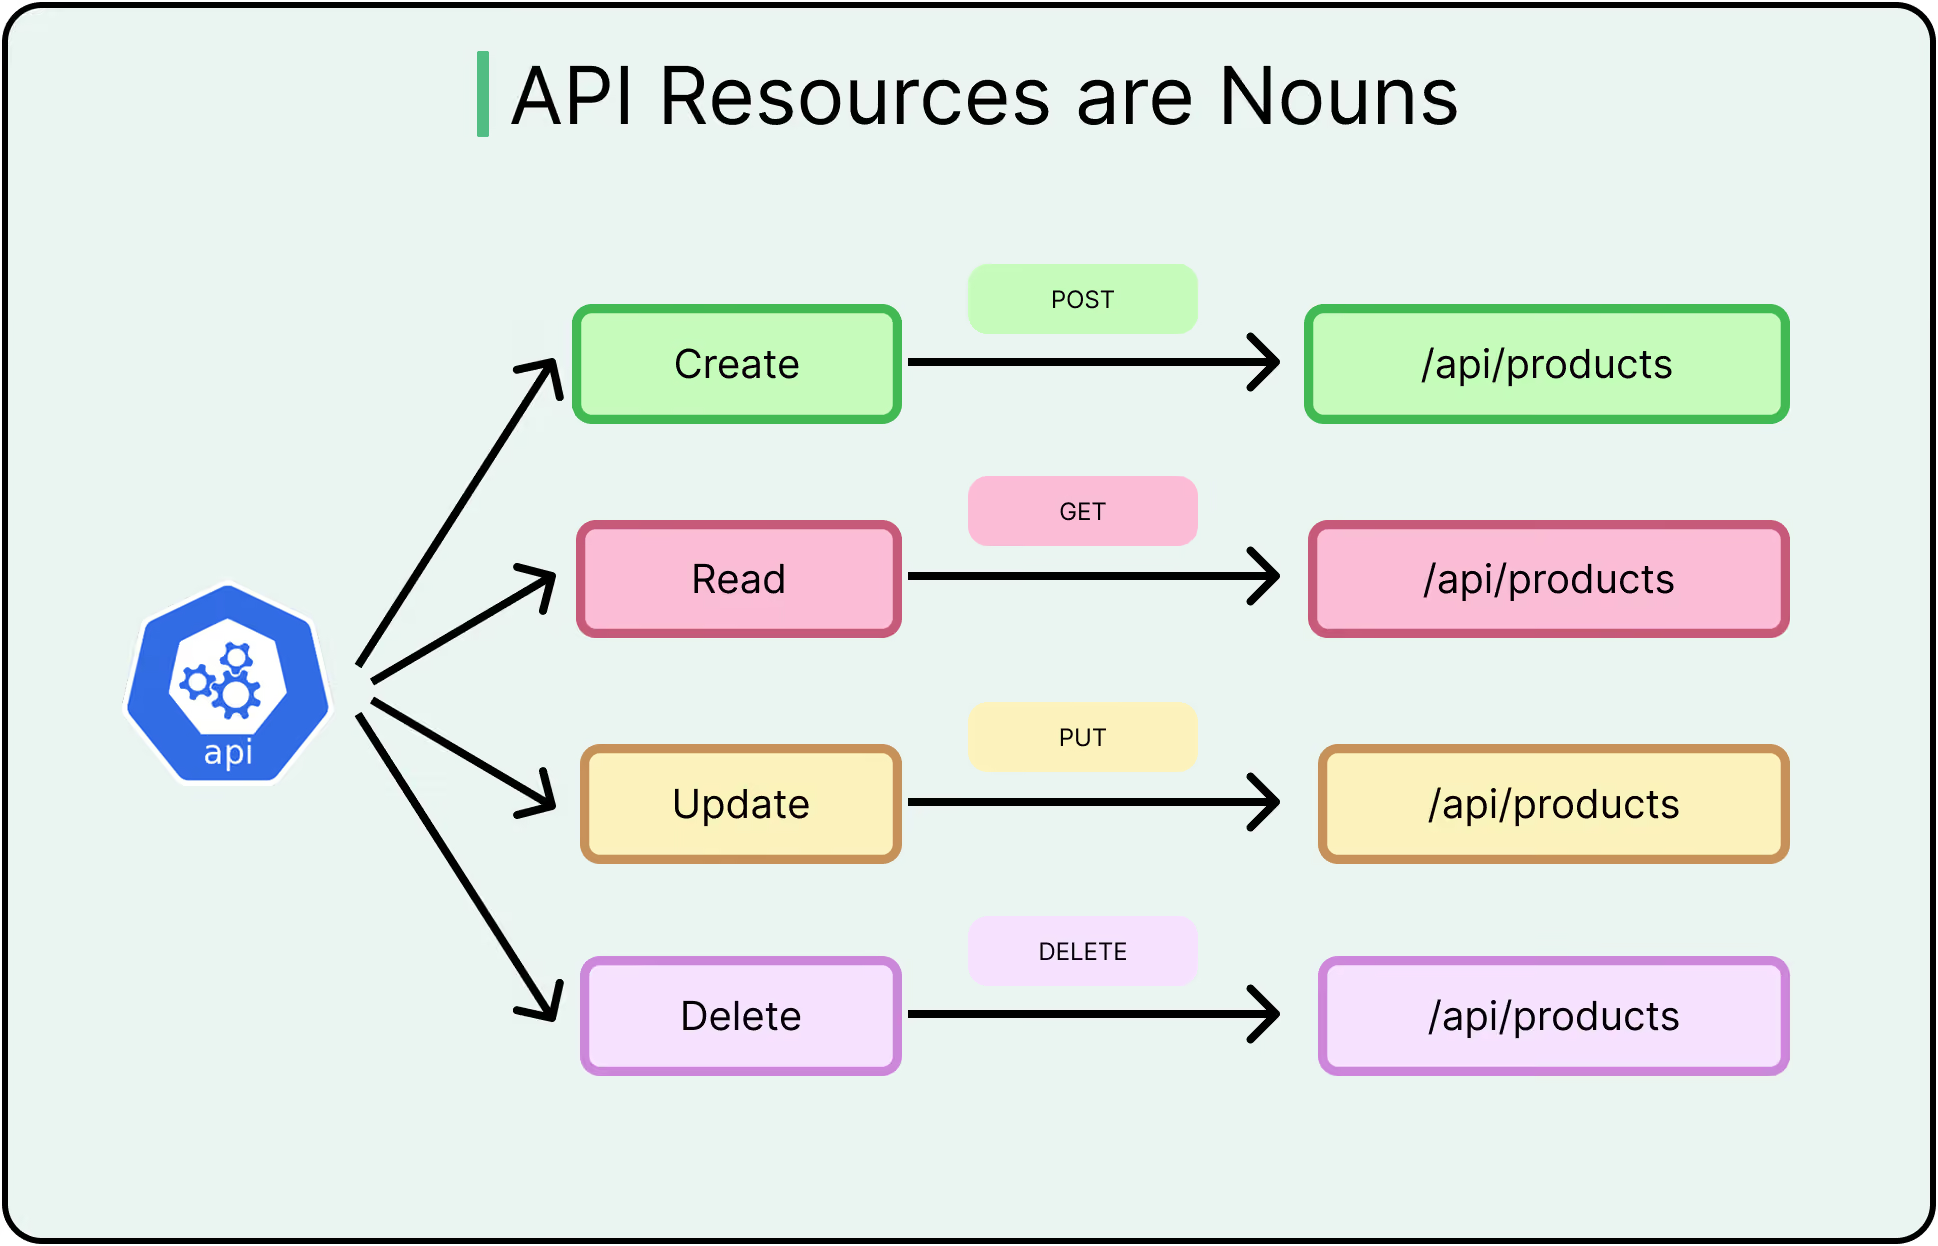
There are four reliable methods, listed from most to least reliable.
Method 1 (most reliable): OpenAPI / Swagger documentation
If your team maintains an OpenAPI specification (swagger.json or swagger.yaml), this is the gold standard. The spec is a machine-readable inventory of every path and method your API exposes.
Count every unique path-plus-HTTP-method combination in the paths object. A path that supports GET, POST, and PUT counts as three endpoints. Most OpenAPI tooling can generate this count automatically. If you use Swagger UI, the total is visible in the interface. If you want a precise count from the raw file, a short script or even a careful manual review will do it.
If your team does not have an OpenAPI spec and you have more than a handful of endpoints, generating one before your pentest is worth the effort. It doubles as documentation and speeds up ongoing scoping conversations.
Method 2: Route inspection in code
For teams without API documentation, the codebase is the source of truth. Ask your developers to search the codebase for route definitions using the patterns specific to your framework:
- Express.js:
app.get, app.post, app.put, app. delete, router.use - Django REST Framework:
urlpatterns, @api_view - Laravel: Route:
:get, Route::post, Route::put - Spring Boot:
@GetMapping, @PostMapping, @PutMapping, @DeleteMapping, @RequestMapping - Rails:
run "rails routes"from the command line to dump the full route table - Laravel:
"php artisan route: list"produces the equivalent output
Each decorated route or registered handler is one endpoint. A developer familiar with the codebase can typically produce this count in under an hour using a grep or a global search in their IDE.
Method 3: Proxy and traffic interception
Tools like Burp Suite or OWASP ZAP can operate as an intercepting proxy between your browser and your application. Walk through every feature in the application while the proxy is running, and it will capture every unique API call made during the session.
This method is the most thorough for black-box scenarios where code access is limited. You need to exercise every feature, every role, and every workflow to get a complete picture. If testers later discover endpoints that were not hit during your walkthrough, the count will be low. In black-box scenarios, this method may serve as the primary source of truth. When documentation or code access is available, it is best used to validate and supplement counts derived from specifications or code.
Method 4: API gateway or infrastructure review
If your application routes traffic through an API gateway such as AWS API Gateway, Kong, or Apigee, the gateway's route configuration is a highly reliable source of truth. Gateways enforce what routes exist and which methods they accept, so the configuration reflects what is actually reachable. Export the route list directly from the gateway console or CLI and count from there.
How to Count GraphQL Operations
GraphQL requires an entirely different mental model. A GraphQL API typically exposes a single endpoint (often /graphql). The attack surface is not that URL; it is the operations the endpoint accepts. Those operations fall into two categories: queries (reads) and mutations (writes).
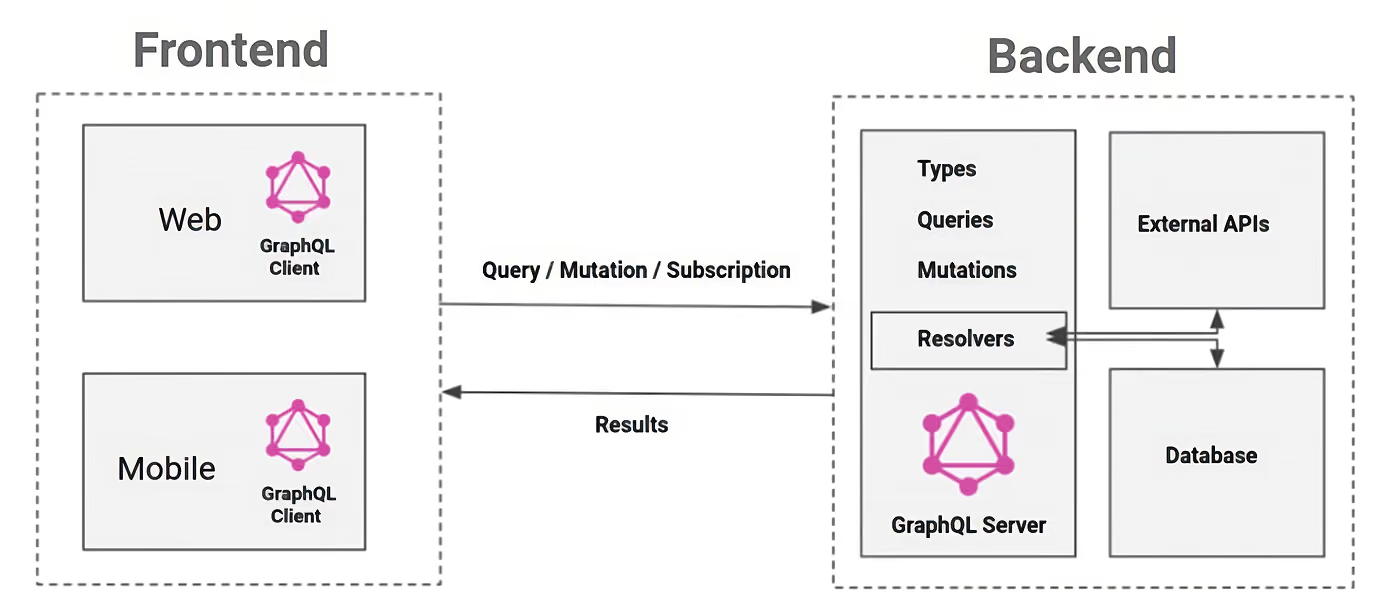
Do not report that you use GraphQL with one endpoint. Report the operation count: for example, "14 queries and 9 mutations, for a total of 23 operations." That is the number that drives the engagement and your penetration testing cost.
Step 1: Schema Introspection (if enabled)
GraphQL introspection lets any client query the schema itself. In development and staging environments, it is typically enabled by default. To retrieve the schema, run the following introspection query:
curl -X POST https://your-api.com/graphql \
  -H "Content-Type: application/json" \
  -d '{"query": "{ __schema { queryType { fields { name } } mutationType { fields { name } } } }"}'
The response includes the full list of available queries and mutations. Count all fields under queryType and all fields under mutationType for your total operation count.
Step 2: Schema File Review (if introspection is disabled)
Production GraphQL APIs often turn off introspection as a security measure. If that is the case, ask the development team for the schema definition file (typically schema.graphql or provided as SDL). Count every field defined under type Query and every field defined under type Mutation.
Step 3: Frontend Code Validation
As a cross-check, search the frontend codebase for .graphql files or gql template literals in JavaScript or TypeScript. Each named operation (written as query MyOperation { ... } or mutation UpdateUser { ... })represents an operation the frontend actually uses. This surfaces operations that matter in practice and confirms your schema count reflects exercised functionality, not dead code.
How to Count MVC Architecture
Server-rendered applications built on MVC frameworks (ASP.NET, Django, Rails, Laravel) do not expose a formal REST API in the same way. However, they still have a countable attack surface: controller actions. Each controller action that handles an HTTP request is the functional equivalent of an API endpoint.
The fastest way to get your count is to use the framework's built-in route inspection commands:
- Rails: rails routes
- Laravel: php artisan route:list
- Django: python manage.py show_urls (requires django-extensions)
- ASP.NET: review route tables in RouteConfig.cs or attribute routes on controllers
Count every unique route-plus-method combination in the output. Controllers with multiple actions (index, show, create, update, destroy) count as one action per method, not one per controller.
How to Count JavaScript Routes
Single-page applications built with React, Vue, or Angular define their own client-side routing. Those client-side routes do not map one-to-one to backend endpoints, but inspecting the client-side route configuration tells you which backend calls are made for each view, helping you build a complete picture.
For each client-side route, identify which API calls fire when the route renders. Those are the backend endpoints to count. Frameworks make this reasonably accessible:
- React Router: review the routes defined in your Routes or Switch component
- Vue Router: review the routes array in your router/index.js or router/index.ts file
- Angular: review the RouterModule configuration and lazy-loaded route modules
Each route typically triggers one or more API calls on load, plus additional calls in response to user interactions (such as form submissions, filtering, and pagination). Trace those calls to get an accurate count of backend endpoints.
How to Estimate API Endpoints Without Documentation
Sometimes documentation is incomplete, code access is limited, and proxy traffic capture is impractical before a scoping call. In those cases, a feature-based estimate is a reasonable fallback.
Count the number of distinct features in your application: login, user management, billing, reporting, and so on. For each feature, assume approximately five backend operations: Create, Read, Update, Delete, and List (CRUD + List). Five operations per feature is a conservative middle estimate; data-heavy features may have more, simple display features may have fewer.
A 20-feature application using this method produces an estimate of roughly 100 endpoints. Submit that estimate with the caveat that it is based on feature counts rather than direct inspection, and a rigorous pentest firm will either validate it during the scoping call or adjust the engagement accordingly.
Other Inputs That Affect Your Pentest Quote
Endpoint count is the primary driver of scope, but it is not the only one. Three additional factors consistently affect the effort required for a pentest and, therefore, its cost.
Number of Authentication Methods
Each authentication method your application supports is a distinct attack surface that must be tested independently. Username and password, Google SSO, magic links, API keys, and MFA flows are not interchangeable because each has a different vulnerability profile and requires different testing techniques. An application with three login methods does not triple the scope, but it meaningfully adds to it.
Before your scoping call, list every method a user can use to authenticate: standard credential login, OAuth providers (Google, GitHub, Microsoft), SAML for enterprise SSO, API key or token-based access for non-human callers, and any passwordless or MFA flows. If your application has a separate login path for admins, that counts as an additional method. The more entry points there are in your application, the more thoroughly each one needs to be tested.
Number of Roles
Roles affect scope because authorization is one of the most common and consequential vulnerability classes in web applications. A tester needs to verify that each role can access only what it is supposed to and that a lower-privileged user cannot escalate to a higher-privileged role. That verification has to happen for every sensitive endpoint, for every role in scope.
Count the number of distinct permission levels in your application. An admin who can do everything, a standard user who can manage their own data, and a read-only viewer are three roles. If your system has custom permissioning where different users see different subsets of features, work with your team to identify the meaningful, distinct profiles rather than counting every unique permission combination. Three to five roles are typical for a SaaS application; more than that warrants a specific conversation about how authorization testing will be scoped.
Number of Integrations
Third-party integrations create boundaries where data flows in or out of your application, and those boundaries may need to be tested. A payment processor, CRM sync, webhook receiver, analytics platform, email provider, or third-party API can introduce risk if your application does not properly validate, authenticate, or handle data from that service.
List every external service your application sends data to or receives data from. Common examples include Stripe, Salesforce, HubSpot, Segment, SendGrid, Twilio, analytics platforms, webhook providers, and other third-party APIs. Your pentest firm can help determine which integration boundaries are relevant to the engagement and which fall outside the agreed scope.
Bring Your Count or Uncertainty to a Scoping Call
An accurate endpoint count is the single most valuable thing you can bring to a scoping conversation. It protects you from surprise costs mid-engagement, gives the pentest firm the information it needs to staff and schedule correctly, and ensures the test covers the real attack surface of your application.
But if you do not have a perfect number, that is fine. Most organizations do not walk into a scoping call with a complete inventory. Bring what you have: a rough feature list, a partial API doc, a Swagger file you are not sure is current, or just an honest "we have never counted this before." Software Secured will work through it with you.
Ready to find out what your attack surface actually looks like? Book a scoping call with Software Secured.
Frequently Asked Questions
Why do penetration testing quotes vary so much between vendors?
Vendors use different scoping methods. Some count domains, some count pages, some count backend endpoints. A vendor counting pages on a modern SPA will see a fraction of the actual attack surface compared to one counting API endpoints.
Additionally, some vendors rely more heavily on automated tools, outsource to lower-paid global contractors, or maintain extensive toolkits that require higher margins. Ask vendors for their approach.
Does GraphQL count as one endpoint for pentest scoping?
No. A GraphQL API has one URL but many operations. Report your operation count, not the number of URLs.
What's the fastest way to count my REST API endpoints before a scoping call?
If you have an OpenAPI/Swagger spec, count every unique path-plus-HTTP-method combination.
What factors affect pentest cost beyond endpoint count?
Three things consistently add to scope: the number of authentication methods (each login path has a distinct vulnerability profile), the number of user roles (authorization must be verified per role per sensitive endpoint), and the number of third-party integrations (each is a data boundary that needs testing).
Ready to get in touch? Get started by booking a consultation now.
About the author

Kaycie Waldman
Demand Generation Manager
Kaycie Waldman works closely with SaaS, cloud, and technology organizations on security, risk, and compliance initiatives that support growth and enterprise readiness. Her work spans strategic content, go-to-market initiatives, and customer trust programs designed to support scale, compliance, and enterprise sales.




.avif)